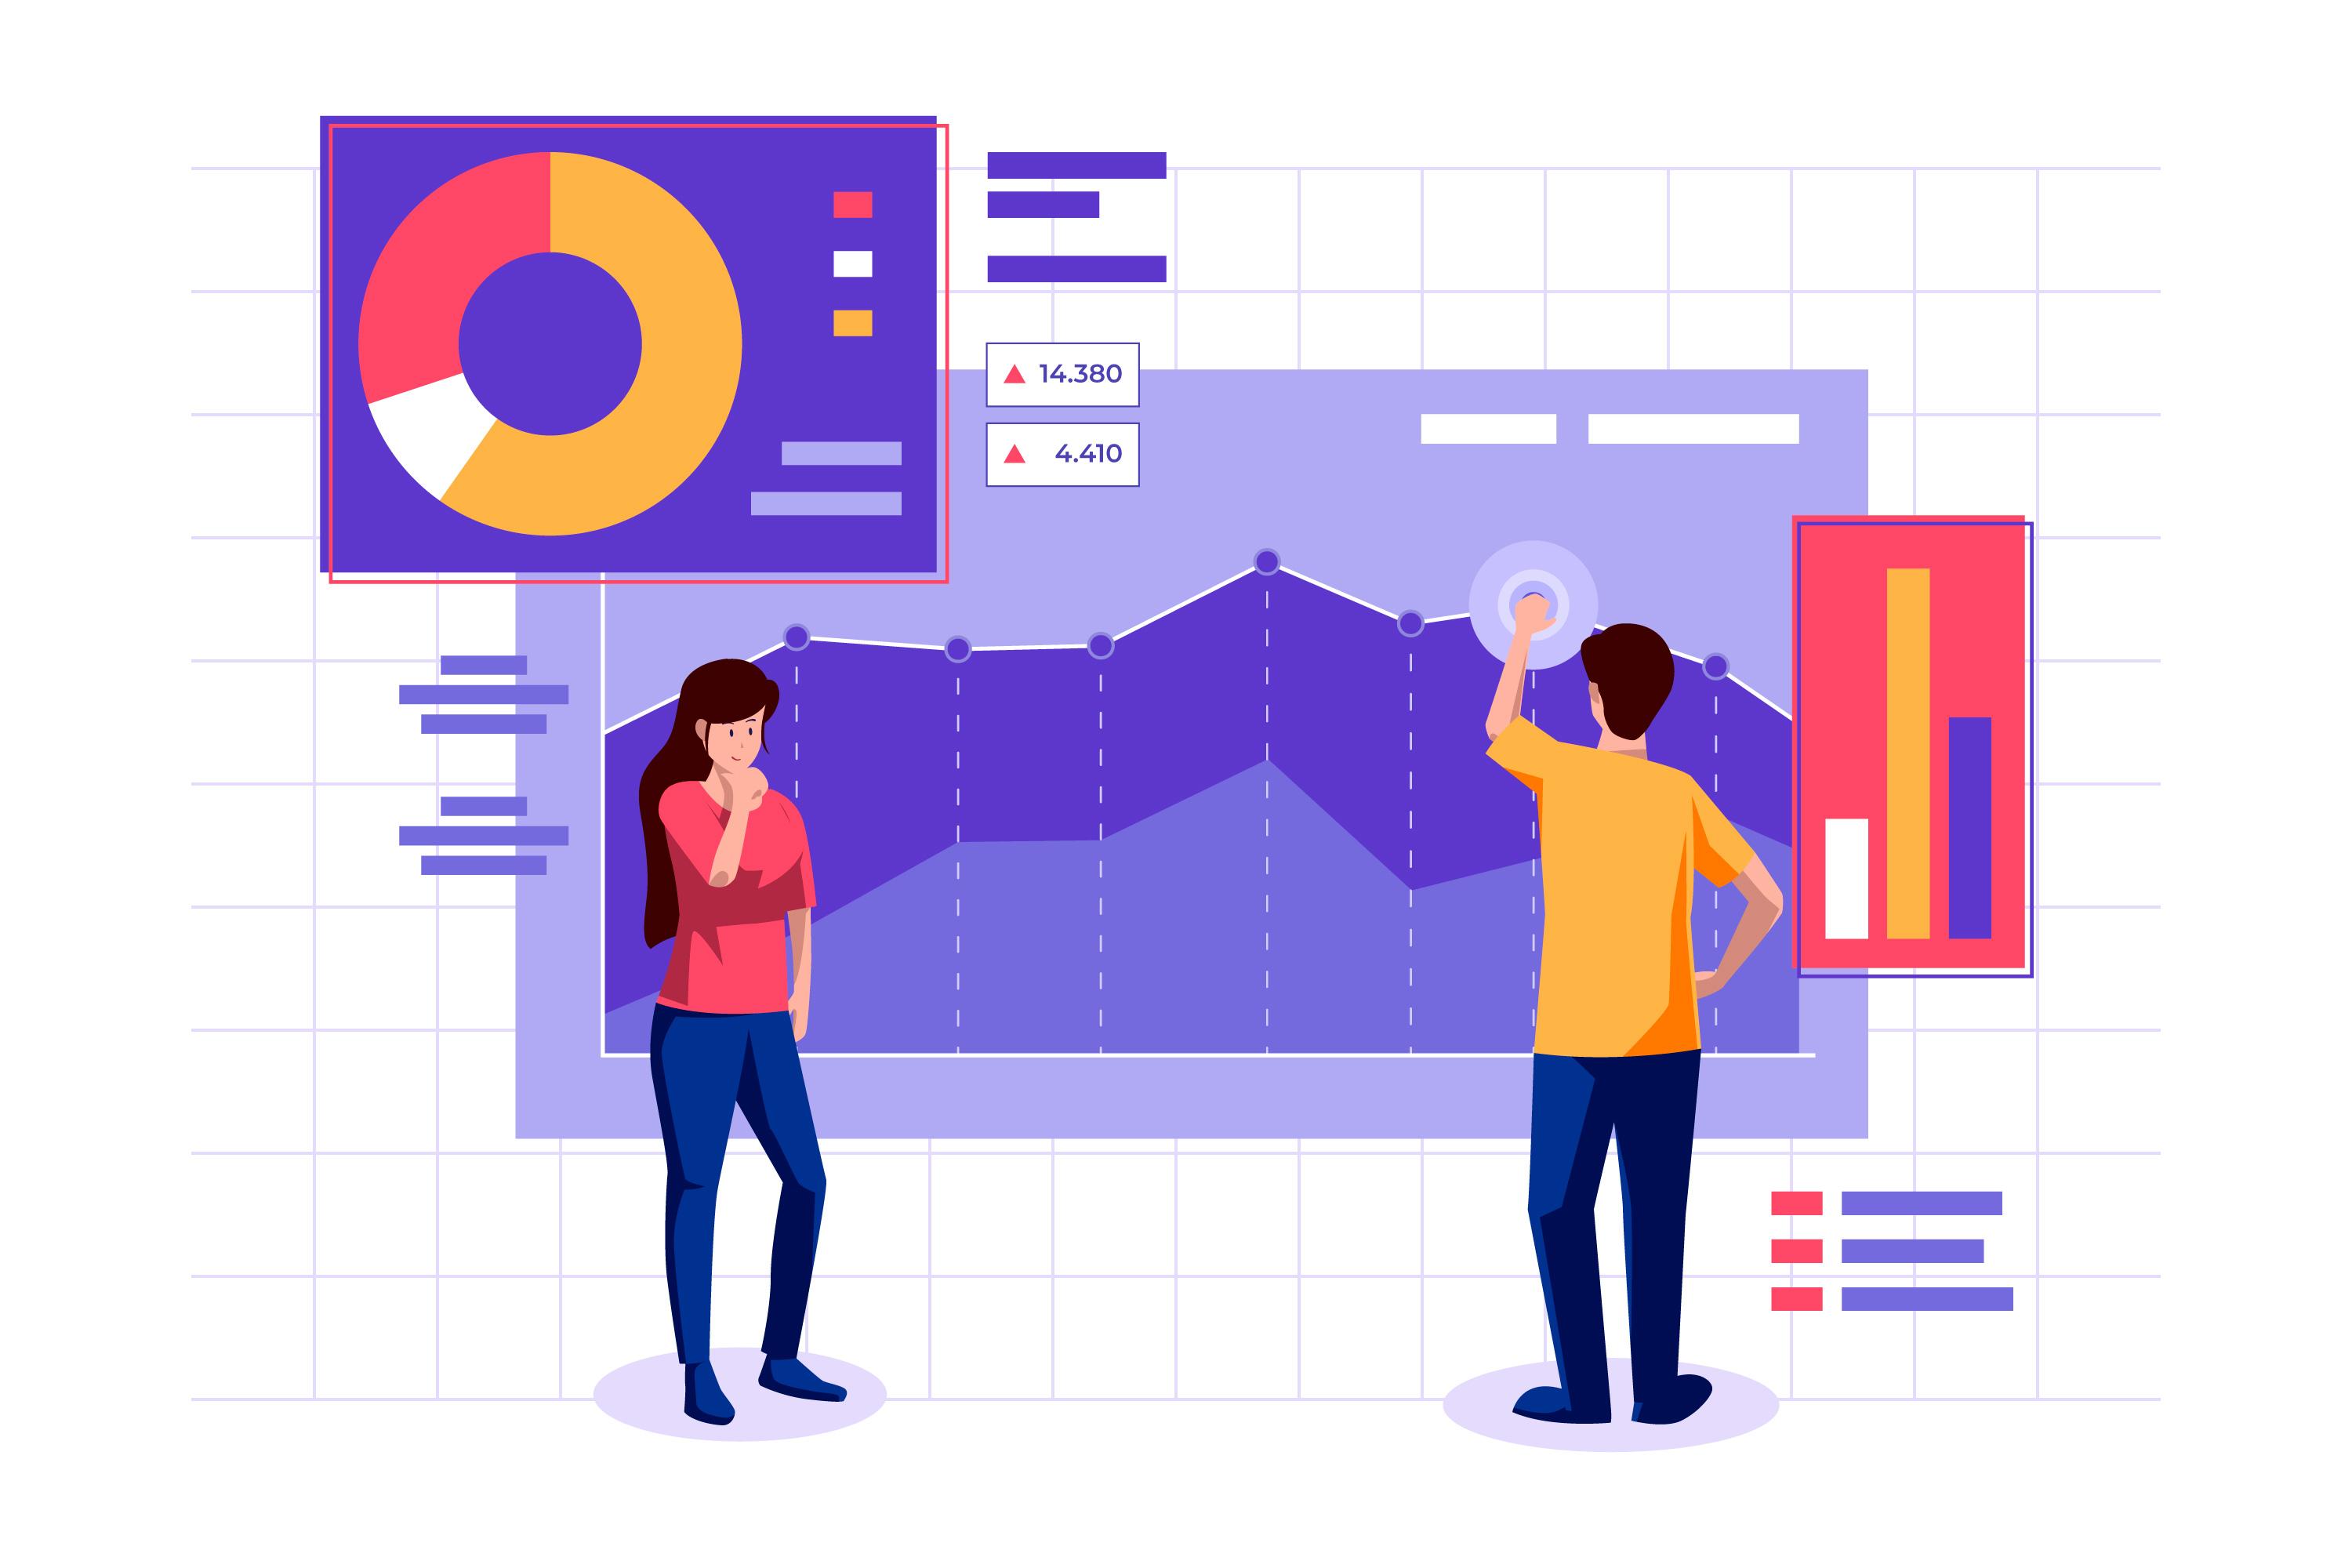
Imagine this. The CFO looks at the accounts receivables dashboard, as the first thing in the morning; and it keeps spinning. After waiting for long time he/she sees the dashboard in all red. That slowness right at the start of the day, can mess his/her mood, for the entire day. Here the issue is not on the data or business. The issue is due the poor performance.

We all love breezy dashboards. The management should get the key numbers/metrics, on a daily basis, or in real time. For example, the sales head may want to know - number of new leads today, number of leads followed-up, number of demos conducted today, number of client meets today, number of proposals sent out today and number of wins/misses today. These numbers cannot come from thin air, but the sales people need to feed the transaction data and from that this can be plotted.
The pleasure in these analytics and/or pretty dashboards is due to the fact that these numbers are vital for the business. Management looks at these numbers quite often. The pleasure can quickly become a pain, if the dashboard keeps loading, making the management to look at the spinning wheel!
If the data entry screens are slow - your end users will feel that pain.
If your dashboards/analytics screens are slow, your management will feel that pain.
If users and/or management feel that pain, your support team and IT ops team will feel a
magnified pain.
Should we allow these people to feel that pain of slowness, right at the start of the day?


